Folder Explainer
Back to folderResearch Explainer · Flyvbjerg et al. (2026)
Most IT projects stay near budget, but a small minority run spectacularly over
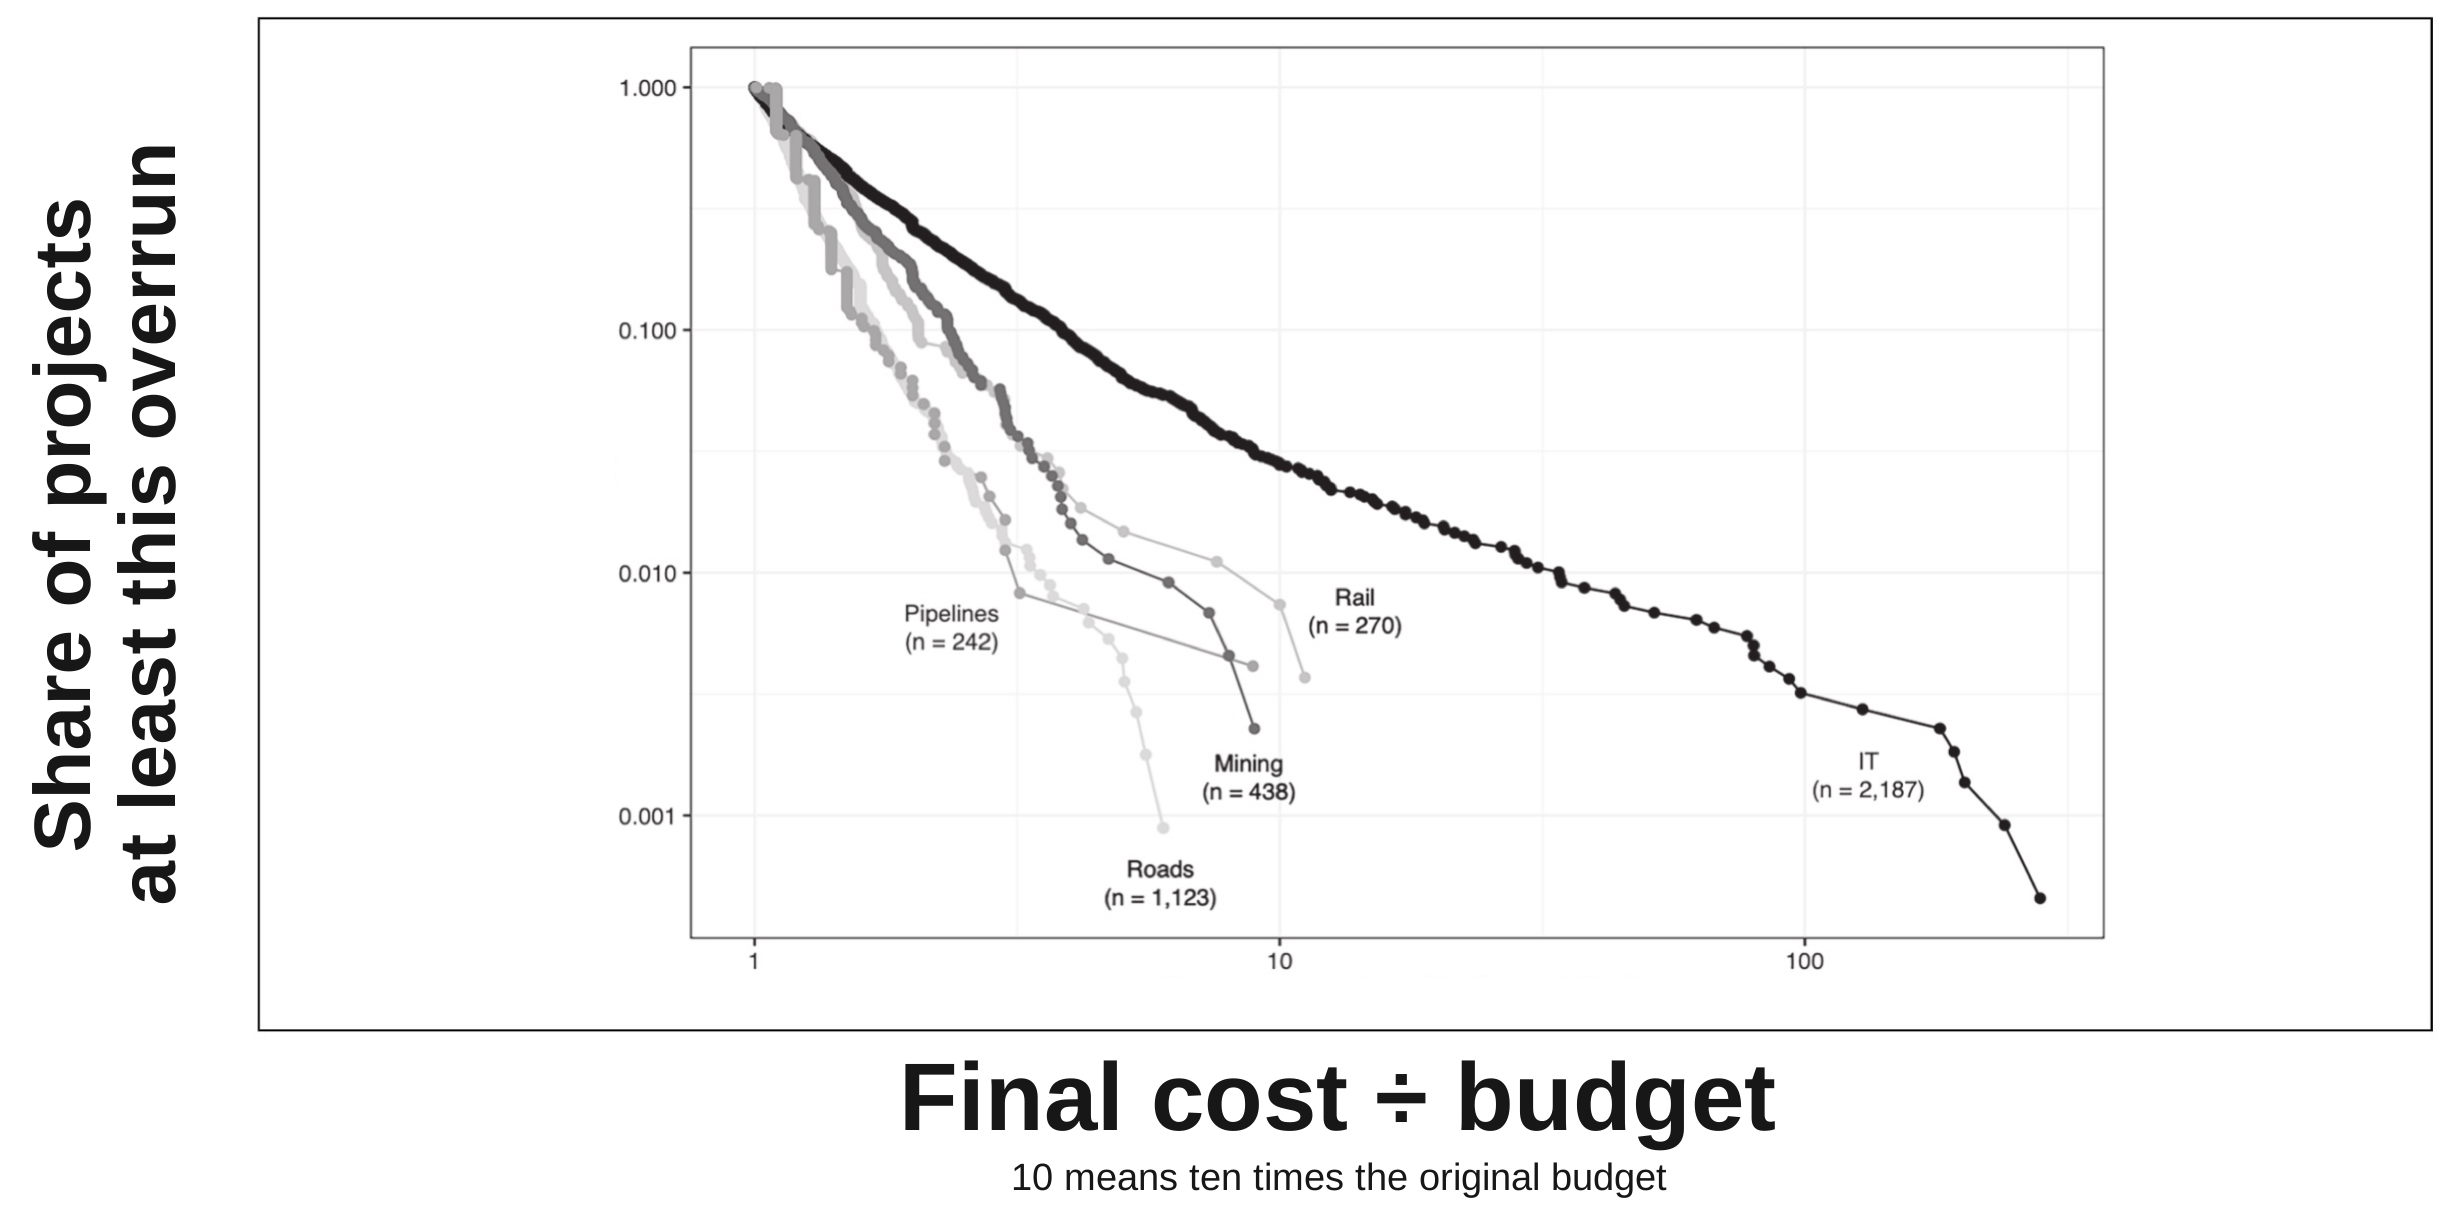
Across 5,360 IT projects, 59% finished on or below budget. But the severe-overrun group averaged 453% above budget, creating a fat tail: rare outcomes so large that ordinary averages become dangerously reassuring.
Published February 2026
59.14% of IT projects finished on or below budget
18.26% ran more than 50% over budget
453% average overrun within that severe-overrun group
11,011 projects across 23 types in the full comparison
The barbell: many near budget, a few disasters
The result has two very different ends. Of 5,360 IT projects, 59.14% finished on or below budget. Yet 18.26% ran more than 50% over, and that severe-overrun group averaged 5.53 times its estimate, or 453% over budget.
The paper calls this a barbell pattern: a large group near budget at one end and a smaller group of disasters at the other. A fat tail is that second end stretched unusually far. Rare failures do not taper away quickly, so a handful can dominate the total. The frequency of overruns is not the main danger. Their potential size is.
| Project type | Projects studied | Any overrun | Over 50% above budget | Average final cost in severe cases |
|---|---|---|---|---|
| IT | 5,360 | 40.86% | 18.26% | 5.53× budget |
| Nuclear storage | 25 | 92.00% | 52.00% | 5.27× budget |
| Roads | 2,086 | 53.84% | 9.97% | 2.01× budget |
| Mining | 886 | 49.44% | 16.93% | 2.29× budget |
| Rail | 372 | 72.58% | 27.15% | 2.22× budget |
| Pipelines | 437 | 55.38% | 9.61% | 2.05× budget |
How quickly extreme-overrun risk fades
How to read it: each bar is a tail-risk fade rate, called alpha in the paper. Shorter bars mean the chance of an even larger overrun falls more slowly. A score of 1 or below means extreme cases remain common enough that the fitted model has no stable long-run average. IT is the only project type beyond that threshold.
Why the average stops working
The paper gives each project type a tail-risk fade rate, technically the Pareto alpha. It asks a simple question: as overruns get larger, how quickly do they become rarer? Lower scores mean the danger fades more slowly. IT's central estimate was 0.92, the lowest of all 23 project types.
At a score of 1 or below, the fitted model has no stable long-run average or spread. No invoice is literally infinite. The point is that as more projects are observed, occasional disasters can keep dragging the calculated average upwards instead of letting it settle. An average-based contingency can therefore look precise while resting on a number that will not hold still.
IT's 95% confidence interval runs from 0.75 to 1.17, crossing the critical score of 1. So the evidence clearly shows an unusually heavy tail, but does not prove with certainty that the true population sits beyond that exact boundary. The risk is real; the mathematical category remains an estimate.
| Risk level | Tail-risk fade rate (paper: α) | What it means in practice | Project types |
|---|---|---|---|
| Extreme | α ≤ 1 | No stable average or spread; a few cases can dominate any sample | IT |
| Very high | 1 < α ≤ 2 | The average can settle, but volatility does not; contingency ranges remain unstable | Buildings, dams, defence, fossil thermal power, hydroelectric dams, nuclear power, nuclear storage, Olympics, rail |
| High | 2 < α ≤ 3 | Average and spread can settle, but the results remain strongly lopsided and extreme-event prone | Aerospace, bridges, mining, pipelines, rail stations, roads, tunnels, water |
| Elevated | 3 < α ≤ 4 | Average, spread and lopsidedness settle; rare extremes still dominate tail-heaviness | Oil and gas |
| Moderate | α > 4 | All four summary measures settle; conventional averages are more defensible | Energy transmission, nuclear decommissioning, solar power, wind power |
How the comparison was tested
The dataset contains 11,011 projects across 126 countries and six continents, worth US$4.64 trillion in 2023 prices. The descriptive analysis used every project. Tail analysis began with the 5,596 projects whose actual cost exceeded the estimate, with the theoretical fits applied above selected tail cut-offs.
Cost overrun was actual divided by estimated real cost, with the estimate fixed at the final investment decision and actual cost measured at go-live. The authors compared Pareto and lognormal fits using quantile plots and three goodness-of-fit tests, then estimated alpha and its 95% confidence interval with a 500-iteration nonparametric bootstrap.
Sensitivity checks covered source, size, duration, completion year, classification and statistical method. No historical trend was detected, and neither duration nor estimated cost was significantly associated with overrun. Around 25% of candidate cost data was rejected for poor quality, while badly managed projects may be less likely to release records at all. The reported tail may therefore be the polite version.
| Data source | Projects |
|---|---|
| Owner accounts | 2,845 |
| Freedom of information requests | 2,653 |
| Public records | 4,141 |
| Academic studies | 1,372 |
| Total | 11,011 |
Why IT might be different
The paper begins with four explanations from prior research: immaturity, intangibility, goal ambiguity and stakeholder resistance. Each could amplify cost risk, and IT may combine all four more intensely than physical project types. The study does not measure them directly, so the data support the theory without proving its causal chain.
The cross-project pattern suggests two additions. The fattest-tailed types cluster around bespoke, tailor-made delivery, while modular solar, wind and transmission projects sit at the thin-tailed end. IT projects also averaged only 3.2 years against 6.9 years elsewhere, so short duration did not buy safety. The authors suggest that rushed, fast decisions may cancel the usual advantage of speed. That is a plausible diagnosis, not a causal result wearing a lab coat.
Four inherited explanations and two additions organise the paper's causal argument.
- ImmaturityIT is a younger discipline with less accumulated standardisation, regulation and costing experience.
- IntangibilitySoftware lacks physical milestones, remains unusually malleable and often hides integration trouble until work is under way.
- Goal ambiguityUnclear objectives feed requirements volatility, scope creep and escalation.
- Stakeholder resistanceIT changes workflows and power, giving affected users and outside actors reasons to obstruct implementation.
- BespokenessTailor-made systems multiply novelty and interdependence, while modular components repeat what has already worked.
- Fast thinkingShort cycles may compress planning and encourage biased decisions. Speed looks efficient until it starts feeding the tail.
What the study cannot prove
This is an observational comparison, so it cannot establish final causality. The proposed mechanisms were not directly measured. The analysis covers upfront capital cost through go-live, not lifecycle cost, and it does not separate IT subtypes. Schedule evidence was preliminary, while benefit data was too sparse for analysis.
Project-type samples also vary sharply: nuclear decommissioning had 16 projects, the Olympics 21 and nuclear storage 25. Some distribution fits were inconclusive or produced conflicting tests, and the fitted IT Pareto tail used 48 observations above its selected cut-off. Its 95% confidence interval also crosses the alpha-equals-1 boundary. A serious tail does not grant immunity from sampling uncertainty.
For practice, the paper argues against normal-distribution assumptions and casual reliance on mean forecasts. It favours larger reference classes, more deliberate decisions, and standardised modular systems built from smaller repeatable parts. Those remedies still need causal testing. The paper has found the tail. It has not yet found the hand pulling it.
THE PRACTICAL CONSEQUENCE
Treat IT cost forecasts as tail-risk decisions, not ordinary estimates with a little contingency added. Use large reference classes, preserve extreme outcomes in the data, and reduce bespoke interdependence through modular design. The sensible response is not a more confident average. It is a project design that gives the tail fewer places to hide.
Reference
Flyvbjerg, B., Budzier, A., Aaen, J., Keil, M., & Zottoli, M. (2026). The uniqueness of IT cost risk: A cross-group comparison of 23 project types. Project Management Journal, 57(1), 14-43. https://doi.org/10.1177/87569728251340590