Folder Explainer
Back to folderResearch Explainer · Folland (2025)
The Met Office has forecast global temperature a year ahead for 25 years with striking accuracy, but the 2023 heat spike slipped past everyone
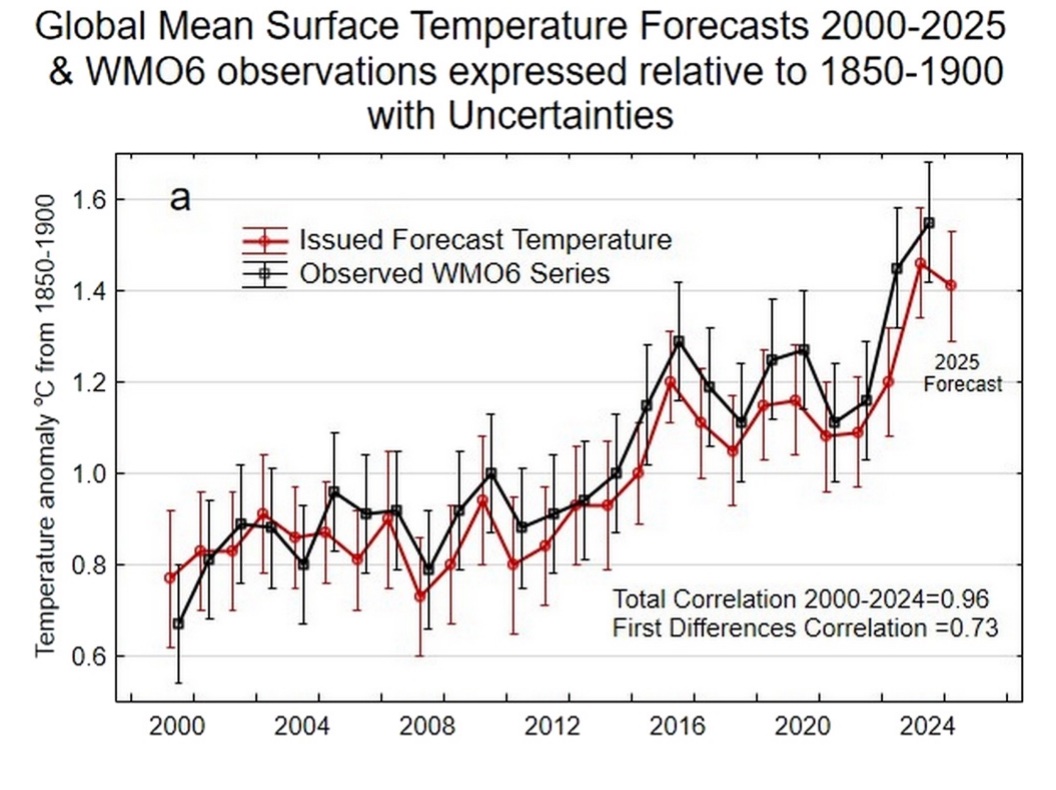
A review of 25 real-time annual forecasts of global mean surface temperature finds a correlation of 0.96 with observations and errors under a tenth of a degree, alongside one glaring miss in 2023 and a well-called record year in 2024.
Published September 2025
0.96 correlation between the 25 issued real-time forecasts and observed global temperature, 2000–2024
0.09°C root mean square error of the issued forecasts against observations over the full 25-year record
0.25°C how far the 2023 forecast fell below the observed record warmth, the only year to test the joint 90% uncertainty range
1.5°C the dynamical model's 2024 forecast, correctly flagging the first calendar year likely to reach the Paris threshold (1.55°C was observed)
One forecast a year, two ways of making it
Every December since 1999, the Met Office has issued a forecast of the coming year's global mean surface temperature anomaly. It sounds simple. It is not. A good forecast has to get the greenhouse gas warming trend right and anticipate the natural wobbles layered on top, of which the El Niño-Southern Oscillation is the loudest but far from the only voice.
Two methods do the work. The statistical forecast is a multiple regression trained on over a century of data, fed five predictors: an Atlantic Multidecadal Oscillation index, an ENSO index from the preceding October and November, smoothed solar and volcanic forcing indices, and net greenhouse gas and aerosol forcing for the forecast year itself. The 2024 equation attributed 0.86°C of its 1.41°C forecast to greenhouse forcing alone, with ENSO chipping in 0.11°C.
The dynamical forecast, added in 2008, comes from DePreSys, a physics-based climate model initialized with observed ocean temperature, salinity, and sea ice. The model is nudged toward reality until 1 November, then released to run freely into the forecast year. The current version, DePreSys3, runs 40 ensemble members and draws its uncertainty range from their spread. Since 2011 or so, the issued forecast has weighted the two methods equally.
A quarter century of scorecards
The headline numbers are strong. Against the WMO6 observational record (an average of six independent global temperature datasets, referenced to the 1850–1900 preindustrial baseline), the issued forecasts correlate at 0.96 with a root mean square error of 0.09°C. For context, the same team reported a correlation of just 0.75 for the 2000–2011 period back in 2013, though there was less warming trend to ride in those years.
A cynic would say a high correlation is cheap when the trend does most of the work. The authors anticipate the cynic. Strip out the trend by looking at year-to-year changes and the issued forecasts still correlate with observed changes at 0.73 over 2000–2024, significant at better than the 0.1% level. The forecasts also have realistic variance: the standard deviation of forecast interannual differences is 0.10°C against 0.11°C observed. This is genuine skill at predicting the wiggles, not just the slope.
One curiosity in the breakdown: the statistical method actually beats the dynamical model on interannual changes (correlation 0.83 vs 0.61 over 2008–2024, with a significantly lower error), while the dynamical model carries a smaller overall cold bias. Neither method dominates, which is precisely why the issued forecast blends them.
| Forecast type | R 2000–24 | R 2008–24 | RMSE 2000–24 (°C) | RMSE 2008–24 (°C) | Bias 2000–24 (°C) | Bias 2008–24 (°C) |
|---|---|---|---|---|---|---|
| Issued forecasts | 0.96 | 0.97 | 0.09 | 0.10 | -0.06 | -0.09 |
| Dynamical forecasts | – | 0.94 | – | 0.10 | – | -0.07 |
| Statistical forecasts | 0.95 | 0.97 | 0.11 | 0.13 | -0.08 | -0.11 |
| Issued (interannual diffs) | 0.73 | 0.79 | 0.08 | 0.07 | -0.01 | 0.00 |
| Dynamical (interannual diffs) | – | 0.61 | – | 0.10 | – | 0.00 |
| Statistical (interannual diffs) | 0.76 | 0.83 | 0.08 | 0.07 | -0.01 | -0.01 |
The year that got away, and the one that didn't
Then came 2023. Global temperature jumped 0.29°C in a single year, from 1.16°C to 1.45°C above preindustrial, a leap last matched between 1975 and 1976. The issued forecast predicted a rise of just 0.11°C. Both methods missed by similar margins: the statistical forecast landed at 1.16°C and the dynamical at 1.23°C against the observed 1.45°C. It was the only year in 25 to strain the joint 90% uncertainty range, and it sat only marginally inside it.
The miss was not for lack of seeing El Niño coming. The dynamical model weakly captured the La Niña to El Niño transition. What neither method caught was intense warming in the Atlantic in both hemispheres, across much of the southern hemisphere, and over Canada and the adjacent Arctic. The 2023 surge surprised the whole field, with proposed culprits including record-low planetary albedo from unusually cloudless anticyclonic conditions and reduced aerosol cooling after the 2020 cut in shipping emissions. The Hunga Tonga eruption's stratospheric water vapor probably contributed, but only slightly.
2024 restored some pride. The dynamical model forecast 1.5°C, remarkably close to the observed record of 1.55°C, and correctly flagged 2024 as the first calendar year likely to reach or exceed the Paris Agreement's 1.5°C marker. The statistical method came in cooler at 1.41°C. Spatially, the dynamical forecast also won, mostly by capturing more of the ocean warming.
| Year | Observed (°C) | Dynamical (°C) | Statistical (°C) | Dynamical spatial r | Statistical spatial r |
|---|---|---|---|---|---|
| 2016 | 1.29 | 1.20 | 1.20 | 0.68 | 0.16 |
| 2022 | 1.16 | 1.13 | 1.04 | 0.55 | 0.58 |
| 2023 | 1.45 | 1.23 | 1.16 | 0.44 | 0.34 |
| 2024 | 1.55 | 1.50 | 1.41 | 0.64 | 0.49 |
| 2025 | – | 1.44 | 1.38 | – | – |
The cold bias hiding in the training data
The statistical forecasts have run 0.11°C cold since 2008, and the reason is instructive: the regression was trained on an older blend of temperature datasets (WMO3) that warms more slowly than the current six-dataset WMO6 record. The gap averaged 0.09°C over 2000–2021 and grew fastest during the forecast period itself, mainly because WMO6 better captures rapid Arctic warming. Train on a dataset that undercooks the Arctic and your forecasts inherit the chill. Switching to WMO6 training data from 2023 should shrink the bias, though a strong cold residual remained in 2023 and, to a lesser extent, 2024.
The authors flag two forward risks. If anthropogenic aerosol cooling really is declining faster than the forcing datasets assume, as some recent work suggests, the statistical method's cold bias would steadily worsen unless its forcing inputs are revised. And a Pinatubo-scale volcanic eruption landing mid-forecast-year would cool the planet fast enough to demand a revised forecast issued partway through, something the current December-only cadence does not do.
None of this diminishes the core result. Twenty-five consecutive real-time forecasts, made before the fact and published for scrutiny, have tracked both the warming trend and its year-to-year texture with errors under a tenth of a degree. The one year that broke the system, 2023, broke everyone's, and understanding why remains one of climate science's more uncomfortable open questions.
THE BOTTOM LINE
Annual global temperature is genuinely predictable a year ahead: 25 real-time Met Office forecasts correlate at 0.96 with observations and retain significant skill even after the warming trend is removed. The physics-based dynamical model correctly called 2024 as the first year likely to reach 1.5°C above preindustrial. But the unexplained 0.29°C surge of 2023 exceeded both methods by a wide margin, a reminder that the climate can still produce jumps the best forecast systems do not see coming.
Reference
Folland, C. K., Colman, A. W., Dunstone, N. J., Smith, D. M., & Scaife, A. A. (2025). A review of 25 annual forecasts of global mean surface temperature including the record warm years 2023 and 2024. Geophysical Research Letters, 52, e2025GL117308. https://doi.org/10.1029/2025GL117308