Folder Explainer
Back to folderResearch Explainer · Yu (2026)
AI has reached core operations, but the productivity payoff is still missing
Advanced AI adoption among S&P 500 firms more than quadrupled between 2022 and 2025. Deep integration was associated with higher profit margins, but not with higher revenue per employee.
Published July 2026
21% of S&P 500 firms using AI in production or integrating it deeply by 2025
67% of advanced adopters concentrated in the technology sector
15 percentage points higher net profit margin associated with deep integration among non-technology firms in the fuller model
No gain in measured revenue per employee associated with advanced AI adoption
Mentioning AI is not the same as using it
The paper tackles an awkward measurement problem. A company can mention artificial intelligence in a filing because it uses AI, fears AI, regulates AI, sells to AI companies or simply wants investors to notice the fashionable acronym. Counting mentions would mix operational change with corporate throat-clearing.
The authors therefore classify each firm-year on a five-level rubric. A score of 1 means the filing contains no evidence of adoption. Scores 2 and 3 capture exploration and limited integration. Only scores 4 and 5 represent production use or deep integration across strategy, operations and financial performance. The language may be corporate, but the test is operational.
| Score | Stage | What the filing must show |
|---|---|---|
| 1 | No current adoption | no evidence of present firm-level AI use |
| 2 | Exploration | capacity-building or limited experiments without embedded operational use |
| 3 | Pilot or specific integration | AI inside particular products or processes without stated financial dependence |
| 4 | Used in production | production deployment with expected cost savings or revenue contribution |
| 5 | Deep integration | AI embedded across business functions and central to strategy and financial performance |
How the study measured adoption
The sample covers 510 companies that appeared in the S&P 500 between 2016 and 2025, yielding 4,561 firm-year observations. Financial outcomes came from Compustat. For each available 10-K filing, the researchers first extracted paragraphs containing a manually refined set of AI-related keywords. They then supplied those passages and the adoption rubric to GPT-5-mini, producing 4,463 adoption scores.
The team manually checked the rubric, prompt and classifications rather than treating the model as an infallible filing clerk. External comparisons were encouraging but imperfect. Industry-level adoption correlated at 0.76 with the US Census Bureau's Business Trends and Outlook Survey and at 0.87 with Ramp's 2025 data. Those sources cover different populations, so agreement is evidence of validity rather than proof.
The resulting measure captures what large public companies disclose about enterprise adoption. It can distinguish a warning about AI from a claim that AI runs part of the business, which a keyword count cannot. It may still miss quiet deployments and reward firms that describe their technology more enthusiastically. The measure is defensible, not clairvoyant.
Each firm-year score came from a two-stage classification process:
- Extract relevant disclosureFind 10-K paragraphs containing the validated AI keyword set.
- Classify operational depthAsk GPT-5-mini to apply the five-level rubric to those passages.
- Check the measureManually inspect classifications and compare aggregated scores with external adoption datasets.
Adoption accelerated, led by technology firms
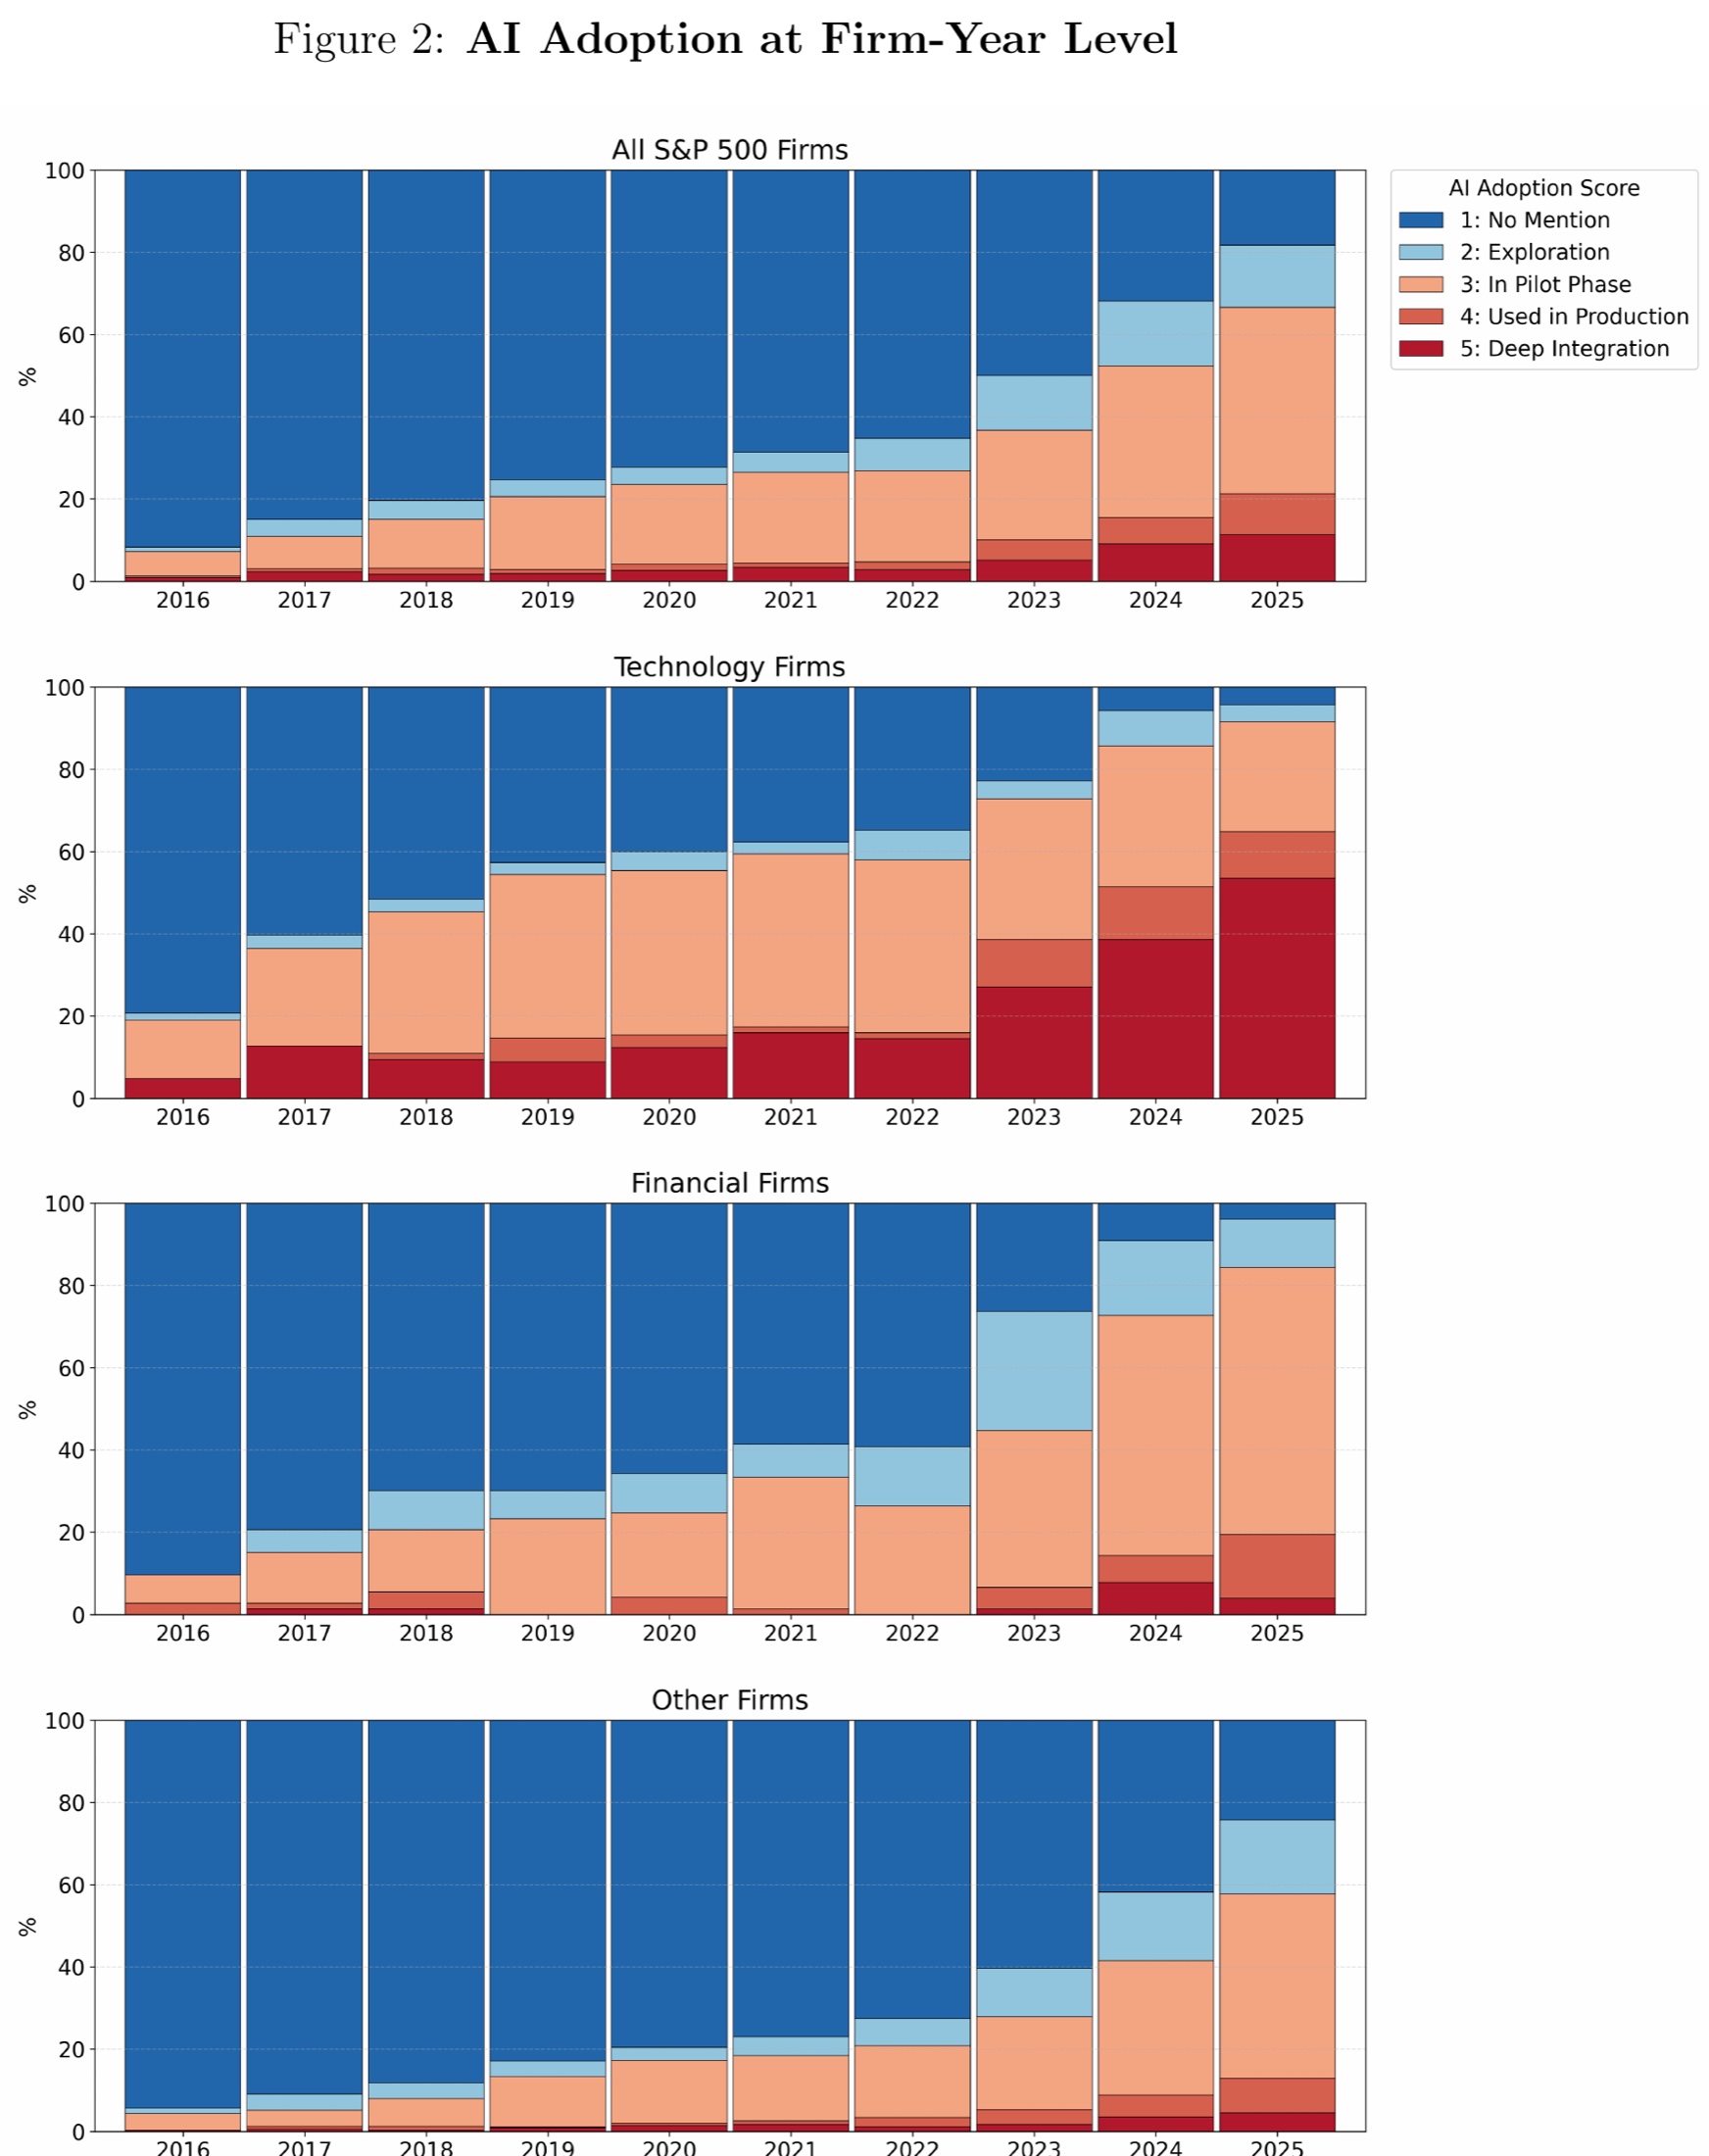
Figure 2 follows firm-year adoption through time. The appendix provides exact values for 2021 to 2025, reproduced below as a table because each year's five categories form a value grid. Production use and deep integration together rose from 4.9% in 2022 to 21.4% in 2025. Meanwhile, the share of firms making no AI mention fell from 65.0% to 18.1%.
The shift was not evenly distributed. In 2025, half of technology firms were deeply integrated and another 11.8% used AI in production. Software, semiconductors and technology hardware were the only broad industry groups where more than half of firms reached those two advanced levels. Among other sectors, deep integration rose from 1.0% in 2022 to 5.7% in 2025. Corporate AI moved beyond experimentation, but the boom remained decidedly lopsided.
| Adoption level | 2021 | 2022 | 2023 | 2024 | 2025 |
|---|---|---|---|---|---|
| No mention | 68.5% | 65.0% | 50.1% | 31.3% | 18.1% |
| Exploration | 4.9% | 8.2% | 13.5% | 15.8% | 15.3% |
| Pilot | 22.1% | 21.9% | 26.2% | 37.5% | 45.2% |
| Used in production | 0.8% | 1.8% | 4.8% | 6.4% | 10.0% |
| Deep integration | 3.7% | 3.1% | 5.4% | 9.0% | 11.4% |
Profitability bends into a J-curve
Profit margins initially fall as adoption deepens, then recover at the highest level. Across firms, early adoption was associated with margins one to three percentage points below those of minimal adopters, while deep integration was associated with roughly six percentage points higher profitability. The authors interpret this as a J-curve: infrastructure, data work, integration and organisational disruption arrive before the benefits.
The fixed-effects results sharpen the sector split. After accounting for firm characteristics, time effects and sector-specific annual shocks, deep integration was associated with net profit margins about 15 percentage points higher among non-technology firms and 2.6 percentage points higher among technology firms. Early-stage differences largely lost statistical significance in that fuller specification. Mature adoption carries the positive association, not AI vocabulary on its own.
Capital spending offers no matching pattern. Adoption was mostly unrelated to capital expenditure as a share of revenue, partly because the exceptional data-centre spending belongs to fewer than half a dozen firms. Most companies buy AI services as operating inputs rather than build model infrastructure themselves. The profit story appears before a broad investment story, which is not the usual order of the sales pitch.
| Outcome | Non-technology firms | Technology firms |
|---|---|---|
| Deep integration and net profit margin | +15 percentage points | +2.6 percentage points |
| Exploration and headcount | about 6% lower | +7.3% |
| Pilot adoption and headcount | about 2% lower | +10.0% |
| Production use and headcount | about 6% lower | +24.7% |
| Deep integration and headcount | about 20% higher | +36.4% |
The productivity result is a null, not a verdict
The study finds no significant positive association between AI adoption and productivity, measured as revenue per employee. That result matters because the sample already contains firms claiming production use and deep integration. Adoption alone did not coincide with more revenue for each worker at the firm level. Aggregate headcount also rose with adoption among technology companies, so the data do not support a simple replacement story.
Revenue per employee is a coarse measure. It cannot observe faster individual tasks, changes in work quality, total-factor productivity or gains trapped behind another business bottleneck. Firm-wide headcount can also conceal layoffs in one occupation and hiring in another. Benefits may take time while companies redesign processes, train staff and remove non-AI constraints. A null result here means no measured firm-level effect, not that every employee gained nothing.
Most importantly, the regressions are correlational. Firm and year fixed effects remove stable company differences and common annual shocks. Lagged adoption reduces direct simultaneity, while sector-year effects absorb shared industry trends. None removes changing management quality, innovation, culture or anticipated demand. Larger and more profitable firms may simply be better able to adopt AI, and high market valuations may encourage investment rather than result from it. The paper finds an intriguing sequence, not a causal receipt.
WHAT TO TAKE AWAY
Large-company AI adoption moved rapidly from pilots into production between 2022 and 2025, with technology firms far ahead. Deep integration is associated with higher profitability, especially outside technology, but the study detects no corresponding improvement in revenue per employee. The sensible reading is that organisational depth may matter more than adoption theatre, while the causal proof remains outstanding.
Reference
Yu, Y., Fleming, M., Hampton, L., Combemale, C., & Thompson, N. (2026). AI Adoption in S&P 500 Firms. arXiv preprint arXiv:2607.08920. https://arxiv.org/abs/2607.08920